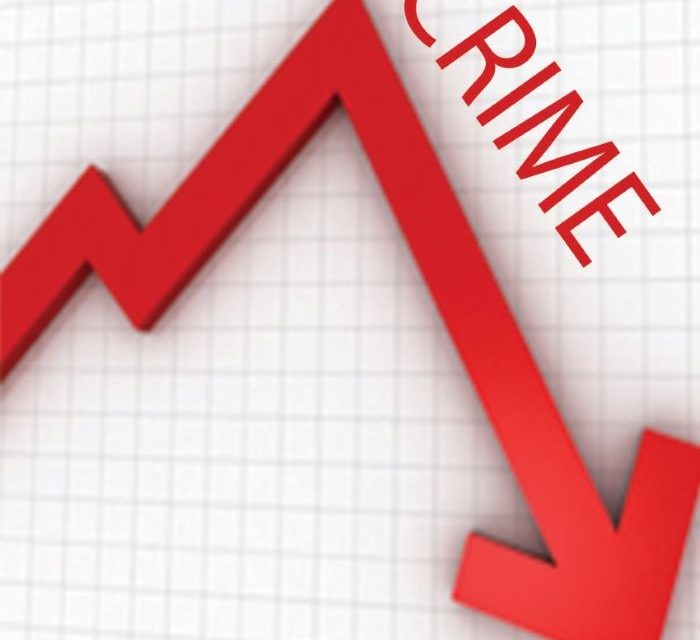
The majority of Memphis zip codes have recorded declines in crimes. It’s a trend line that deserves more media attention.
The following are the declines by zip code in overall crimes for Memphis so far this year. The comparison is based on year-to-date data comparing 2024 to 2023.
27.44% – 38117 – East Memphis
25.44% – 38103 – Downtown
22.59% – 38120 – White Station/East Memphis
18.14% – 38016 – Cordova
17.29% – 38119 – Balmoral/East Memphis
17.20% – 38105 – Uptown/Pinch District
16.16% – 38111 – Normal Station/University of Memphis/Sherwood Forest
16.69% – 38107 – North Memphis/New Chicago/Vollintine-Evergreen
14.66% – 38116 – Whitehaven
14.47% – 38118 – Oakville/Parkway Village
13.18% – 38122 – Berclair/Highland Heights
13.65% – 38128 – Egypt-Raleigh
13.86% – 38134 – Elmore Park
12.66% – CITYWIDE
12.65% – 38125 – Richwood/burlington
12.14% – 38109 – Westwood
11.98% – 38112 – Midtown/Overton Park/Hein Park/Binghampton
9.41% – 38141 – South Riverdale
8.28% – 38108 – Hollywood/Douglass/Hyde Park
6.29% – 38115 – Hickory Hill
6.22% – 38126 – South City/South Forum/Lemoyne-Owen College
6.22% – 38104 – Midtown/Cooper-Young
5.42% – 38127 – Frayser
5.24% – 38018 – Cordova/Shelby Farms Park
3.82% – 38106 – South Memphis/Longview Heights/Prospect Park
1.00% – 38114 – Rozelle/Castalia/Glenview/Orange Mount/Bethel Grove
From January-June, the overall city crime rate declined 10.4%. It is now 12.66% which suggests that the downward trajectory is continuing.
Last year’s 398 homicides set a record. If this year’s number of homicides continues at the present pace, there is a chance the number will not break 300 for the year.
SOURCE: City of Memphis


