Memphis is trapped in a vicious cycle.
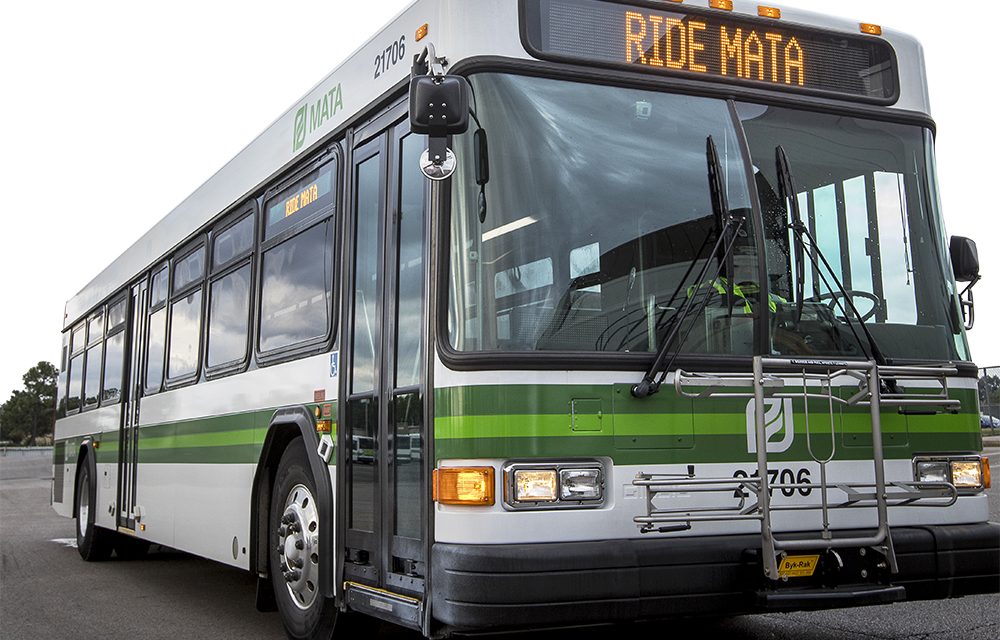
Because MATA cannot mount an efficient system that responds to the needs of the city, Memphians have little choice but to buy cars.
Because Memphians are forced into car purchases, MATA ridership is about two percent of all Memphis workers
Because so few Memphians ride MATA, it finds it hard to become a higher priority.
Because a well-functioning MATA is not a higher priority, more Memphians are forced to buy cars.
And so it goes: Memphis’s Catch-22.
Typically a household’s second largest expenditure, transportation costs are largely a function of the characteristics of the neighborhood in which a household chooses to live, said the Center for Neighborhood Technology (CNT). Compact and dynamic neighborhoods with walkable streets and high access to jobs, transit, and a wide variety of businesses are more efficient, affordable, and sustainable.
The following are the data from CNT that should be factored into transportation policy in Memphis:
Neighborhood Characteristic Score (1-10)
As compared to neighborhoods in all 955 U.S. regions
5.6 – Job Access (moderate access to jobs)
3.9 – AllTransit Performance Score (car-dependent with limited access to public transit)
3.9 – Compact neighborhood (low-density and limited walkability)
Location Efficiency Metrics – places that are compact, close to jobs and services, with a variety of transportation choices, allow people to spend less time, energy and money on transportation:
1% – percent of location efficient neighborhoods
$12,688 – annual transportation costs
1.7 – autos per household
16,567 – average household vehicle miles traveled
2% – Transit ridership
58 – annual transit trips
6.43 tons – annual greenhouse gas per household
3 – Transit connectivity index (0-100)
14 acres – average block size
***
Join me at the Smart City Memphis Facebook page and on Instagram where these blog posts are published along with occasional articles, reports, and commentaries that are relevant to Memphis.


