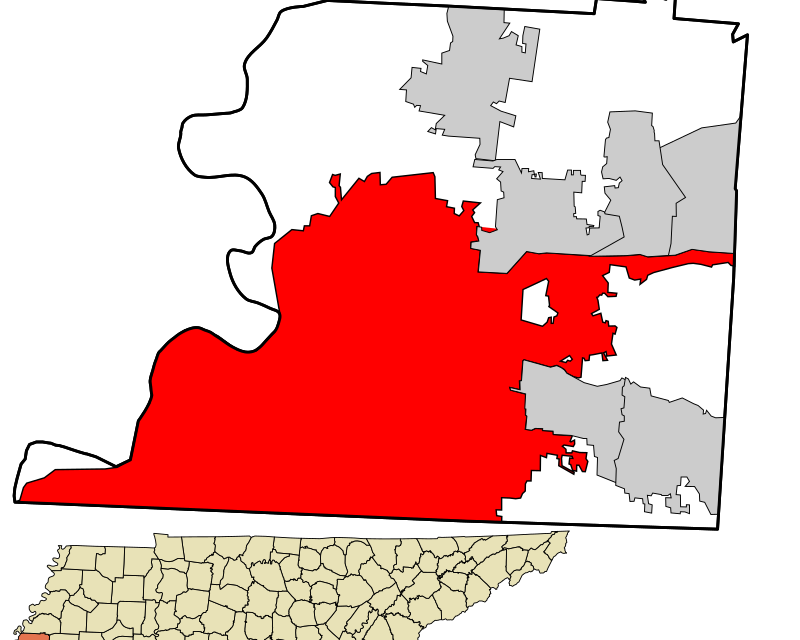
Following up last week’s blog post about density, What Is Memphis’ Right Size, the following are some relevant data points about density:
MEMPHIS’ POPULATION DENSITY
1960:
Population: 497,524
Land Area:129 square miles
Population Density: 3,857 people per square mile
2000:
Population: 650,100
Land Area:279.3 square miles
Population Density: 2,072 people per square mile
2020:
Population: 633,104
Land Area: 296.98 square miles
Population Density: 2,131.8 people per square mile
2023:
Population: 618,639
Land Area: 296.98 square miles
Population Density: 2,085.4 people per square mile
REGIONAL POPULATION DENSITY – 2023
Collierville:
Population: 51,317
Land Area: 24.6 square miles
Population Density: 2,086 people per square mile
Germantown:
Population: 40,267
Land Area: 20 square miles
Population Density: 2,068 people per square miles
Millington:
Population: 11,467
Land Area: 15.6 square miles
Population Density: 735 people per square miles
Bartlett:
Population: 56,030
Land Area: 23.44 square miles
Population Density: 2,390 people per square miles
Lakeland:
Population: 14,147
Land Area: 23.87 square miles
Population Density: 592.7 people per square mil
Arlington:
Population: 15,305
Land Area: 23.02 square miles
Population Density: 632.2 people per square mile
Shelby County:
Population: 910,530
Land Area: 760.55 square miles
Population Density: 1,197.2 people per square mile
DeSoto County:
Population: 195,871
Land Area: 476.35 square miles
Population Density: 411.2 people per square mile


