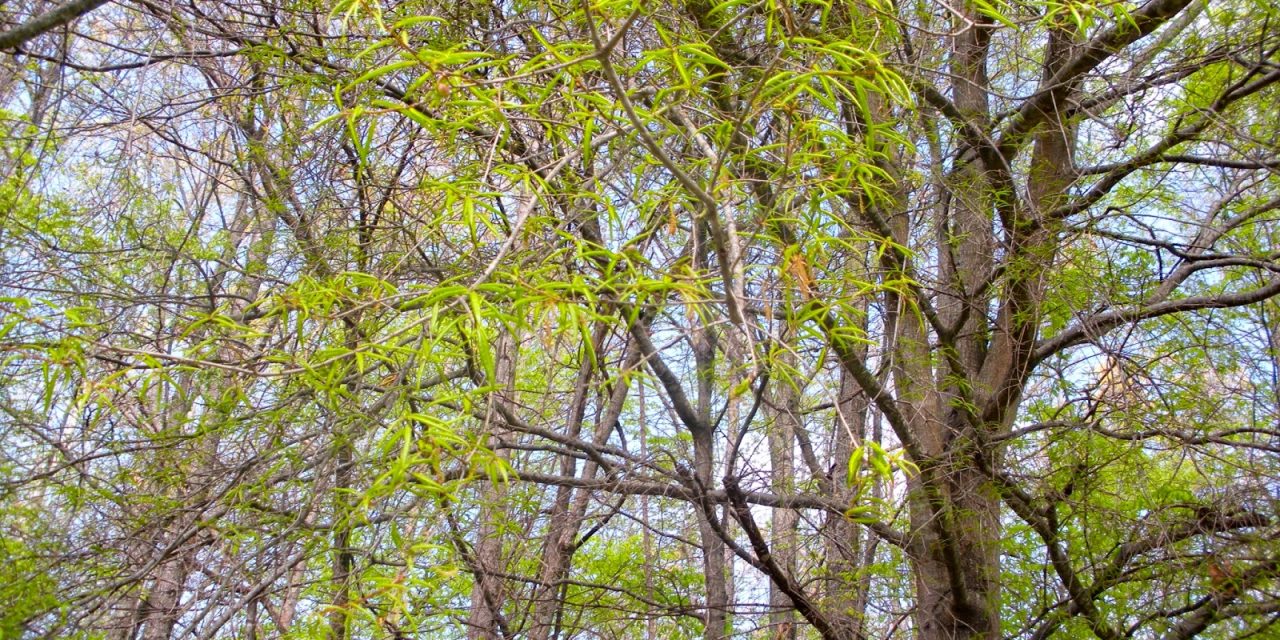
Washington Post answers the question: Which cities have the most trees?
It writes: “Urban trees will only become more important as climate change makes heat waves more intense and longer-lasting. At the same time, the number of Americans living in cities is expected to increase by 18 to 36 million over the next 25 years. That growth doesn’t have to come at the expense of our urban forests, (Rob) McDonald (lead scientist at Nature Conservancy) said. He highlighted examples of neighborhoods both dense and green: They often feature multistory apartment buildings, limited parking above ground and tall trees overhanging courtyards and walkways wherever possible.
“(Vivek) Shandas (professor of urban sustainability at Portland State University)said any region not actively growing ‘verdant urban forests’ risks putting the public’s health in danger as temperatures rise. “The coming decade will be the hottest that any of us have experienced,” he said. “The best time to plant a tree was 20 years ago.”
Here are the tree covers in Memphis and selected cities. Inside the parentheses is the growth of the tree cover in the past five years.
51.4% – Atlanta ( -1.3%)
38.0% – Baltimore (+1.5%)
35.8% – Memphis (+1.8%)
35.4% – Nashville (-1.2%)
33.5% – Cleveland (+0.2%)
32.8% – St. Louis (+0.7%)
32.3% – Austin (+1.4%)
30.0% – Louisville (+1.7%)
27.5% – Detroit (+0.1%)
26.9% – Milwaukee (-0.8%)
18.5% – Oklahoma City (+0.4%)
HOUSE VALUES:
Meanwhile, the Washington Post reports on houses prices in U.S. cities. It writes: “Home prices are cooling off in many parts of the country – even falling in
some regions – as more homes are listed for sale, slightly easing the
long-standing inventory crunch. Prices for single-family homes grew only 2.7 percent nationally in the last year, compared to more than 6 percent the year prior, according to a
Washington Post analysis of home value data from the mortgage technology
division of Intercontinental Exchange (ICE). The market is leveling as demand from buyers remains constrained and more homes come up for sale. But costs still remain highly elevated from the pre-pandemic years – since 2019, prices are up nearly 60 percent.
The following are home prices in Memphis ZIP codes:
+1.1% – 38018 – Cordova/Shelby Farms Park
+0.7% – 38125 – Richwood/Burlington
+0.5% – 38106 – South Memphis/Longview Heights/Prospect Park
+0.3% – 38108 – Hollywood/Douglass/Hyde Park
+0.2% – 38119 – Balmoral/East Memphis
-0.1% – 38128 – Egypt-Raleigh
-0.7% – 38120 – White Station/East Memphis
-0.2% – 38114 – Rozelle/Castalia/Glenview/Orange Mount/Bethel Grove
-0.3% – 38127 – Frayser
-1.2% – 38134 – Elmore Park
-1.3% – 38118 – Oakville/Parkway Village
-1.4% – 38016 – Cordova
-1.5% – 38116 – Whitehaven
-1.7% – 38104 – Midtown/Cooper-Young
-2.1% – 38115 – Hickory Hill
-2.4% – 38112 – Midtown/Overton Park/Hein Park/Binghampton
-3.0% – 38107 – North Memphis/New Chicago/Vollintine-Evergreen
-3.0% – 38109 – Westwood
-4.0% – 38103 – Downtown
-4.2% – 38117 – East Memphis
-4.2% – 38111 – Normal Station/University of Memphis/Sherwood Forest
-4.4% – 38122 – Berclair/Highland Heights
Outside Memphis:
+6.8% – Eads
+2.9% – Millington
+0.3% – Lakeland
+0.3% – Collierville
-0.1% – Germantown (38139)
-0.6% – Arlington
-0.7% – Germantown (38138)
-1.2% – Bartlett
**
These commentaries are also posted on the Smart City Memphis Facebook page and on Instagram along with occasional articles, reports, and commentaries that are relevant to Memphis.

