County Health Rankings & Roadmaps, a program of University of Wisconsin Population Health Institute, has released its latest indicators for Shelby County along with this proviso:
The health of a place results from past and present policies and practices. The land known as Shelby County, along with the entirety of the U.S., has been home for many thousands of years to hundreds of Indigenous nations. Native Land Digital “strives to create and foster conversations about the history of colonialism, Indigenous ways of knowing, and settler-Indigenous relations.”
Shelby County contains neighborhoods recorded as “declining” or “hazardous” investment opportunities through Federal HOLC redlining maps between 1935 and 1940. Local surveyors based assessments on housing, social economic conditions, and residents’ racial or ethnic identities. These records of neighborhood conditions and racist sentiments contributed to intentional disinvestment and discriminatory practices that impact current community conditions.
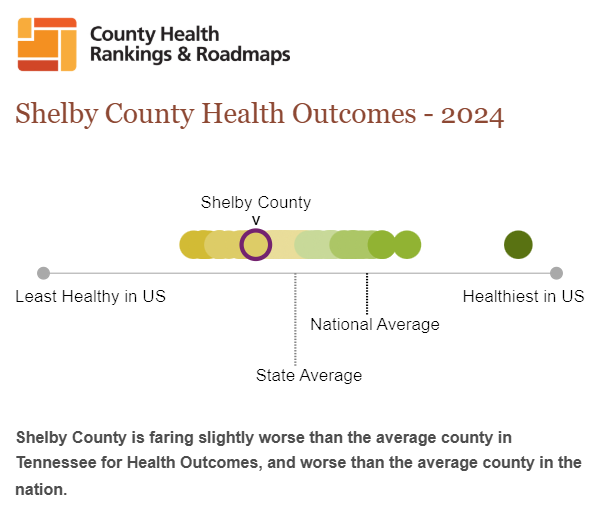
The clear conclusion: Shelby County is faring slightly worse than the average county in Tennessee for Health Outcomes, and worse than the average county in the nation.
Here are some key demographic points:
24.9% – Population below 18 years of age
15.1% – Population 65 and older
54.0% – Non-Hispanic Black
3.0% – Asian
7.1% – Hispanic
2% – Not proficient in English
52.5% – Female
72.5 – Life expectancy
Health Outcomes: how long people live on average within a community, and how much physical and mental health people experience in a community while they are alive.
13,600 – Number of Premature deaths
21% – Poor or Fair Health
4.0 – Poor Physical Health Days for previous 30 days
5.7 – Poor Mental Health Days for previous 30 days
12% – Low Birthweight
90 – Child Mortality per 100,000 children
9 – Infant Mortality per 1,000 live births
13% – Frequent physical distress
18% – Frequent mental distress
14% – Diabetes prevalence
Health Factors: they represent those things we can improve to live longer and healthier lives. They are indicators of the future health of our communities.
19% – Adult smoking
38% – Adult obesity
29% – Physical inactivity
86% – Access to exercise opportunities
15% – Excessive drinking
18% – Alcohol-impaired driving deaths
1,071.1 – Sexually transmitted diseases per 100,000 population
31 – Teen births per 1,000 ages 15-19
13% – Uninsured
1,170:1 – Primary care physicians
1,290:1 – Dentists
2,871 – Preventable hospital stays per 100,000 people in Medicare
34% – Mammography screening
47% – Flu vaccinations
90% – High school completion
64% – Some college
5.5 – Household incomes had income 5.5 times households with lower incomes
44% – Children in single-parent households
11% – Disconnected youths
$42.06 – Living wage for one adult and two children
19% – Severe Housing problems
80% – Driving alone to work
29% – Long commute driving alone
55% – Home ownership
18% – Severe housing cost burden
84% – Broadband access
**
Join me at the Smart City Memphis Facebook page and on Instagram where these blog posts are published along with occasional articles, reports, and commentaries that are relevant to Memphis.


