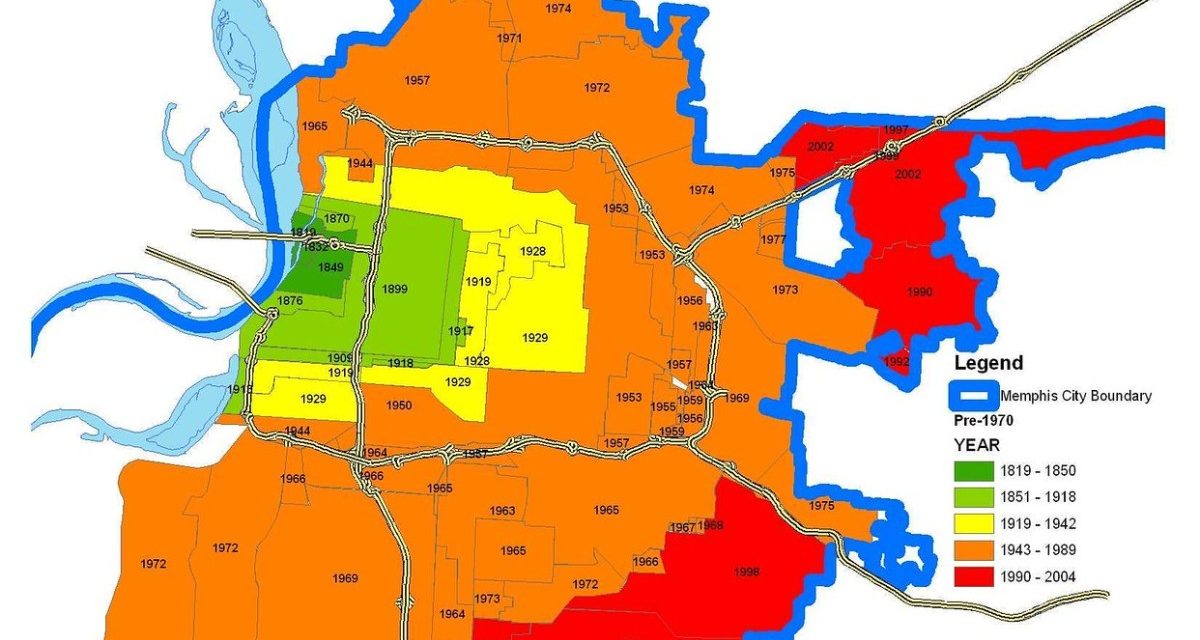
Map indicates areas annexed and dates of annexation; map does not reflect deannexations.
Density matters.
All you need to understand this is to examine how its impact ripples through City of Memphis budgets since the 1970s. As 170,000 Memphians moved out of the 1970 city limits of Memphis over 30 years, city government embarked on an era of aggressive annexations as it chased its former taxpayers as they moved eastward.
Before it ended, the footprint of Memphis had increased by 60% but it had about the same population as when the annexations began. The end result was that the density of the city had been cut in half from the 1960 level and the land area had grown to the size of New York City.
It is this combination of reduced density and the dramatic increase in the size of Memphis’s service area that stretched city resources and created services like public transit that could not keep pace over the ensuing years. To compound the problem, budget priorities were to meet services required in the annexation areas which required core neighborhoods in essence to fund their own decline.
As every entry level planner knows, as densities decrease, it becomes more costly for cities to provide services, as measured per capita. In fact, when Memphis identified Rocky Point, South Cordova, Eads, Riverbottoms, and Southwind/Windyke, it cited low densities and challenges to deliver municipal services as reasons for the removing the areas from the city borders.
Population Loss
Lower density requires more infrastructure per person, such as roads, water, sewer, and electricity. This leads to higher per capita costs for infrastructure, maintenance, and services. More density leads to cost savings through economies of scale and economies of geographic scope.
In core neighborhoods where densities were cut in half, the cost of city services climbed as they were delivered in neighborhoods where vacant lots proliferated, abandoned houses increased, and disinvestment exacerbated the negative results. The missing “teeth” of once connected and dense neighborhoods resulted in services stopping and starting as they move through them.
Here’s the population of Memphis within its 1970 city borders; it shows the loss of people over time:
619,757 – 1970
568,677 – 1980
528,064 – 1990
500,370 – 2000
445,841 – 2010
449,930 – 2013
The Data
The following is the current density for Memphis and other cities followed by Memphis population and land areas over time.
From 1960 to the present, the land area of Memphis climbed from 129 to 315 square miles, as the density per square mile fell from 3,857 to 2,132 people.
Current Population Density – population per square mile – and land area of city:
2,132 – Memphis – 315 square miles
7,962 – Minneapolis – 54 square miles
6,001 – Milwaukee – 96 square miles
5,521 – Pittsburgh – 65 square miles
5,144 – Detroit – 138 square miles
5,107 – Cleveland – 78 square miles
3,923 – Denver – 153 square miles
3,810 – Cincinnati – 78 square miles
3,624 – Columbus, Ohio – 220 square miles
3,781 – Richmond – 60 square miles
3,686 – Atlanta – 135 square miles
3,179 – Raleigh – 147 square miles
2,836 – Charlotte – 308 square miles
2,266 – New Orleans – 170 square miles
2,132 – Memphis – 315 square miles
1,614 – Kansas City – 314 square miles
1,453 – Birmingham – 147 square miles
1,449 – Nashville/Davidson County – 476 square miles
**
Memphis Population by Decades
2023 – 618,639
2020 – 635,639
2016 – 652,717
2010 – 646,889
2000 – 650,100
1990 – 610,337
1980 – 646,174 – 58,000 people moved out of the 1970 city limits between 1970-1980
1970 – 623, 988
1960 – 497,524
1950 – 396,000
**
Memphis Land Area by Decades
2016 – 315.1 square miles
2000 – 279.3 square miles
1980 – 264.1 square miles
1970 – 216.4 square miles
1960 – 129.0 square miles
1950 – 104.2 square miles


