Data Points: Transportation Costs
1%- Location Efficient Neighborhoods – compact places close to jobs and services with
variety of transportation choices
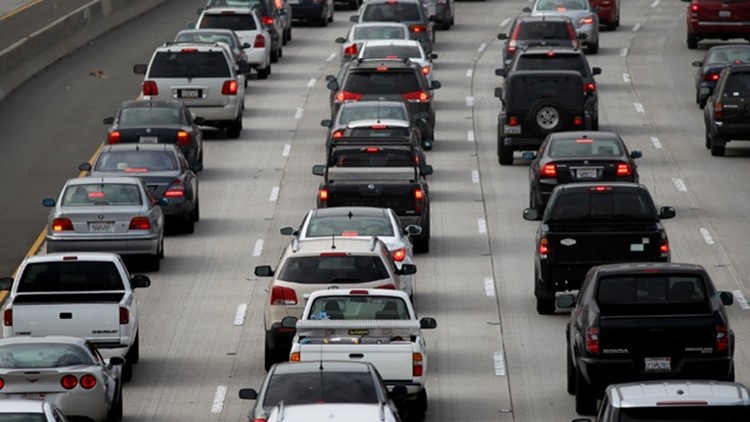
$13,496 – Annual Transportation Costs Per Household
1.7 – Autos Per Household
16,567 miles – Travel miles yearly
2% – Public Transit Ridership
6.43 tons – Annual Greenhouse Gas per Household
48% – Percentage of Income Spent on Housing + Transportation
24% – Percentage of Income Spent on Housing
24% – Percentage of Income Spent on Transportation
66,264 – Number of jobs within 30 minutes transit ride
Source: Center for Neighborhood Technology


24% spent on housing is often in an appreciating real estate asset adding to wealth. 24% spent on transportation (albeit to earn income) is almost always in a depreciating asset taking cash from a bank account. We need to find ways to shift the balance of these two expenditures more toward wealth production.
$13,496 annual transportation costs — per person, per person with a car, per household, per car, per what? I get the costs are high, but that’s not very informative.
Hey Steve,
$13,496 represents annual transportation costs for the “typical” household in the Memphis metro area that has 1.7 cars and travels 16,567 miles annually.