Increasing the population within Memphis is a major priority of the Strickland Administration and economic development leaders, but it is becoming more of a problem for the entire region which is recording population loss in recent Census reports.
Here are some key metrics for how the Memphis MSA stacks up in the rankings of the 50 largest MSAs in the country.
Population Change – 2010-2017:
#1 – Austin (23.3%)
#2 – Raleigh (18.1%)
#8 – Nashville (13.9%)
#13 – Jacksonville (11.8%)
#14 – Atlanta (11.3%)
#18 – Oklahoma City (10.4%)
#30 – Richmond (7.1%)
#33 – Louisville (4.7%)
#40 – Birmingham (1.9%)
#41 – Memphis (1.8%)
#50 – Pittsburgh (minus 1.0%)
Net Migration as Percent of Population, 2016-2017:
#1 – Austin (1.9%)
#5 – Raleigh (1.7%)
#6 – Jacksonville (1.6%)
#9 – Nashville (1.3%)
#14 – Atlanta (0.9%)
#21 – Richmond (0.6%)
#26 – Louisville (0.4%)
#29 – Oklahoma City (0.3%)
#35 – Birmingham (0.1%)
#42 – Pittsburgh (minus 0.2%)
#42 – Memphis (minus 0.2%)
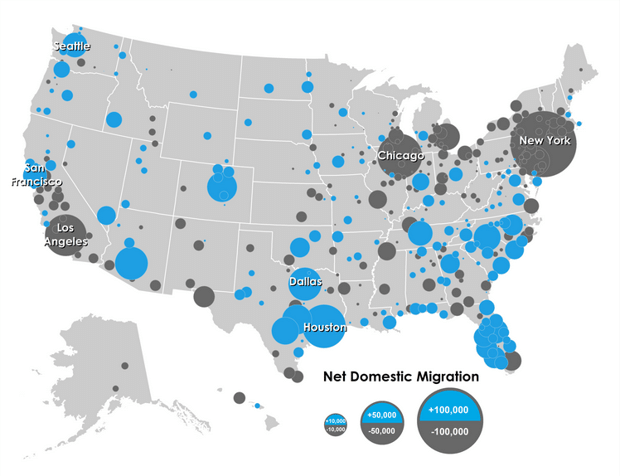
Net Domestic Migration – Percent of 2016 Population – 2016-2017:
#1 – Austin (1.5%)
#4 – Raleigh (1.3%)
#5 – Jacksonville (1.3%)
#9 – Nashville (1.0%)
#13 – Atlanta (0.6%)
#21 – Richmond (0.3%)
#23 – Louisville (0.2%)
#26 – Oklahoma City (0.0%)
#27 – Birmingham (0.0%)
#34 – Memphis (minus 0.4%)
#34 – Pittsburgh (minus 0.4%)
Natural Change – Births minus Deaths as Percent of 2016 Population:
#1 – Salt Lake City (1.0%)
#3 – Austin (0.8%)
#12 – Atlanta (0.6%)
#16 – Oklahoma City (0.5%)
#16 – Nashville (0.5%)
#16 – Memphis
#33 – Jacksonville (0.4%)
#35 – Richmond (0.3%)
#35 – Louisville (0.3%)
#41 – Birmingham (0.2%)
White Isolation – White population in the community of the average white resident, 2011-2015:
#1 – Pittsburgh (89.9%)
#6 – Louisville (84%)
#15 – Nashville (80.1%)
#17 – Birmingham (76.8%)
#25 – Jacksonville (73.0%)
#26 – Oklahoma City (71.9%)
#30 – Richmond (70.0%)
#32 – Raleigh (69.0%)
#35 – Memphis (66.1%)
#36 – Atlanta (65.9%)
#39 – Austin (62.6%)
African American Isolation – Black population in the community of the average black resident, 2011-2015:
#1 – Detroit (68.1%)
#2 – Memphis (67.9%)
#7 – Birmingham (61.8%)
#10 – Atlanta (57.5%)
#14 – Richmond (51.2%)
#18 – Jacksonville (46.6%)
#20 – Louisville (44.1%)
#25 – Pittsburgh (39.7%)
#26 – Nashville (37.6%)
#31 – Raleigh (33.8%)
#34 – Oklahoma City (30.7%)
#42 – Austin (14.1%)
Source: U.S. Census Bureau, American Community Survey 5-Year Estimates


If Census Bureau estimates are anywhere near accurate, Memphis leaders will be sadly disappointed by the results of the 2020 Census. In recent decades, Memphis and Shelby County officials, including the current ones, have not had a grasp of population figures or at least their public comments have not indicated that they understand the figures and what they indicate. Is there anyone in either government who knows what the figures are? Do the mayors, council members and commissioners ever talk to this person or persons? Officials shouldn’t be faulted for putting a positive face on things but do they have any real understanding of what the numbers are and what they show? Major new business investment in a city and the acquisition of professional sports teams are positive things but they will not necessarily be accompanied by population growth in a city. The Memphis area as a whole is experiencing significant outmigration, the estimates show. Are these estimates way off the mark? The 2020 Census should give us some answers. Here is a link to a piece of mine that ran earlier this year: http://www.smartcitymemphis.com/2018/04/memphis-shelby-county-and-msa-population-loss-continues/
I find it hard to believe Strickland, or any administration, can do anything to increase the city’s decreasing population. People are moving away for better opportunities elsewhere and to avoid the problems of Memphis. The same applies to the surrounding counties in our region.
These statistics spell very bad news, especially for the 2020 census since the Trump administration will use our smaller population numbers to cut off even more government assistance and programs. I’m sure that Memphis will suffer very badly as a result of this in the next census.
I took a look back one time and here is what I found: Except for maybe a decade or two, the city of Memphis would not have had any increase in population since 1900 without annexation. After 1960, there was a major movement from Memphis to surrounding areas. Some of that may still be occurring. If this decade’s census estimates are fairly accurate, growth in the suburban areas now is not offsetting the decline in population in Memphis which would mean a lot of people are leaving the metro area entirely. I agree that the reason for that would be economic. Areas that have strong economic growth–whether the jobs are located in the central city or not–attract people. Areas that have slow or no economic growth lose people. Overall, the situation appears to be a very, very complex challenge.
Weak economic growth is a big reason people and businesses choose to leave or not invest in greater Memphis. When this is combined with a very high crime rate and devastating poverty quality of life falls for everyone. All of these factors are working against Memphis.
It’s less important how many people are leaving and more important who is leaving. Is it struggling poor people looking for work elsewhere? Not really a bad thing if you ask me – exactly what they should do. Everybody doesn’t move away for the same reason, and not everyone who leaves is a net loss for the community economically and in other respects. Sounds like s cold thing to say, but it’s true. There are many here who consume more than they produce.
Also remember that net out-migration doesn’t mean people only left and nobody moved in. Dina talks like it’s a one-way exodus and clearly it is not. I would like to see statistics showing the characteristics of the incoming residents vs. the outgoing. Considering all the new infill houses and high-end apartments I see going up or being proposed, we either have some decent earners moving in or people already here are moving up the income scale.
Good point, Chris. As our recent post about millennials indicated, it appears that we are still losing the battle for 25-34 year olds. Also, as Jimmie Covington has pointed out in his blog posts over the years, our population growth continues to largely be births over deaths.
There are exciting projects going up in Memphis, which is why it is troubling that the population in Memphis and Shelby County – and now in the MSA – is going down. Hopefully, these apartments will be the magnet for in-migration.
This isn’t exactly what you’re asking for but it might help: http://www.smartcitymemphis.com/2016/05/data-points-shelby-county-population-and-income-movement/
Thanks for that link. By my calculations during the 2013-14 period, Shelby lost a net 560 people to the suburban counties, 763 to the Nashville MSA, and 2,798 to…Texas! In fact, our net outflow to Austin (1,737) was double the net loss to Nashville metro.
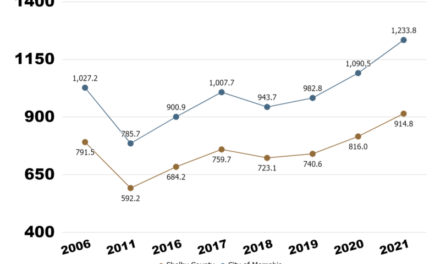
It’s also worth noting just how many people (164,000) migrated in AND out of the county during a 3-year period. That’s around 18% of the population turning over…lots of movement. A net outflow of 11,000 people sounds like a lot, but for a three year period when 164,000 people moved in and out, you can’t say this is a mass exodus.
The income figures cited there don’t look promising, but I would also want to see how the average age of in-migration and out-migration groups compared. If we have younger people coming in while older people retire and move away, it could explain some of the income differential.
Chris: We hear you. We would like all that profile information for people moving in and out ourselves. We continue to look. If we find it, we will definitely post it.